
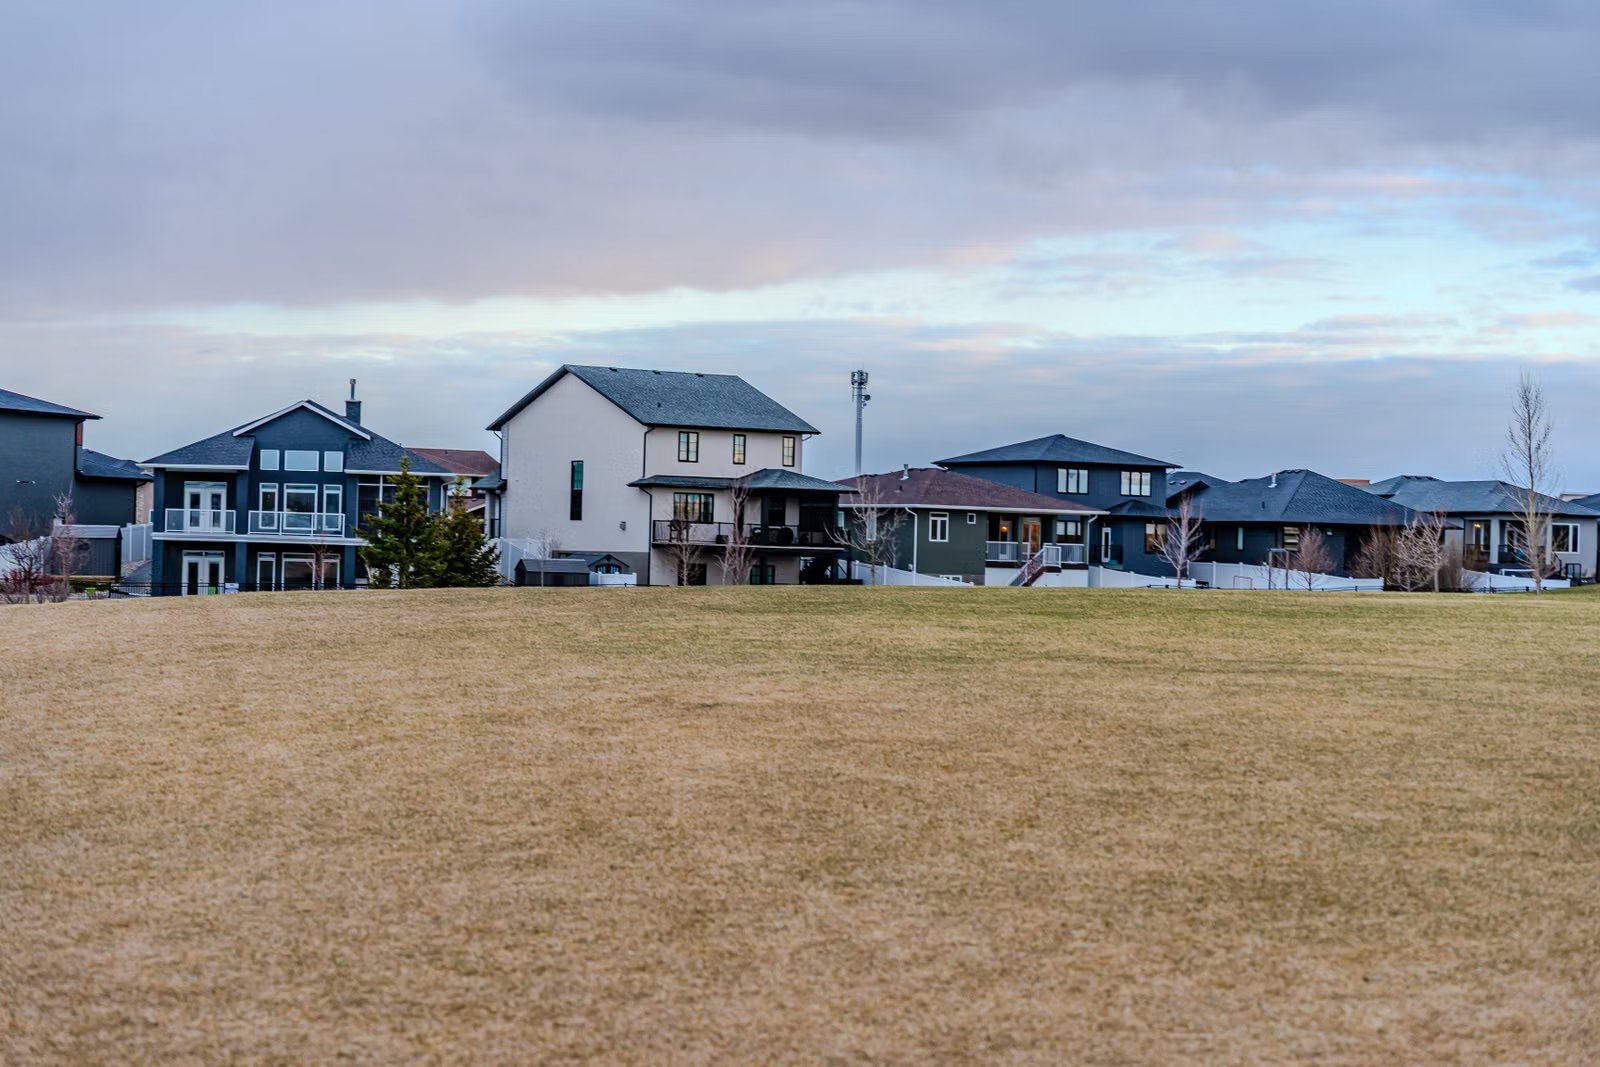
Photo by Rajesh S Balouria via Pexels, free to use under the Pexels License.
Quick Answer: Texas home prices were essentially flat year over year in August 2026, breaking a 15-month run of annual declines, according to the Texas Real Estate Research Center. Closed sales fell 4.7 percent to 28,740 while active inventory stood at 151,400 listings, a 5.3-month supply. The complication is financing: 30-year mortgage rates rose to 7.24 percent in October, their highest level of the cycle.
What did Texas home sales do in August?
The Texas Real Estate Research Center at Texas A&M University published its October 2026 Texas Housing Insight on October 23, 2026, covering revised August data. Statewide, Texas recorded 28,740 closed sales in August, down 4.7 percent year over year. Year-to-date sales nevertheless remained 2.1 percent ahead of the same period in 2025.
The metro pattern is uneven in a way that matters for anyone generalizing about the state. Sales fell 11 percent year over year in Dallas-Fort Worth and 5.7 percent in Houston, while Austin and San Antonio continued posting annual gains, though growth moderated from earlier in the year. On a year-to-date basis Austin was up 7.8 percent, San Antonio up 1.6 percent and DFW up 0.9 percent, while Houston trailed at down 1.2 percent.
| Market | August year-over-year | Year-to-date vs 2025 |
|---|---|---|
| Texas statewide | -4.7% | +2.1% |
| Dallas-Fort Worth | -11.0% | +0.9% |
| Houston | -5.7% | -1.2% |
| Austin | Gain, moderating | +7.8% |
| San Antonio | Gain, moderating | +1.6% |
| United States, existing homes | -3.5% | +1.6% |
Nationally, seasonally unadjusted existing home sales totaled 363,000 in August, down 3.5 percent year over year but 1.6 percent above last year’s pace on a year-to-date basis. Texas therefore fell slightly harder than the nation in the month and held a slightly better year-to-date position.
Forward indicators were soft rather than alarming. Texas pending sales were down 1.1 percent year over year in August, which is the single best near-term signal in the report and points to continued flatness rather than a sharp drop.
Have Texas home prices stopped falling?
Yes, at least in the aggregate, and that is the most significant finding in this report. Texas home prices were flat on an annual basis in August, breaking a 15-month stretch of year-over-year declines. The center attributes the moderation to inventory conditions normalizing rather than to any surge in demand.
The statewide median sales price was $330,000 in August, down from $339,000 in July and $335,000 a year earlier. Note that the median and the price index tell slightly different stories, because the median is sensitive to which homes happen to sell in a given month while the index controls for mix. The index is the better guide to whether prices are actually falling, and it says they have stopped.
Regional divergence is now the rule. Fort Worth recorded its fourth consecutive month of modest annual increases, up 0.6 percent in August after gains of 1.3 percent in June and 0.9 percent in July. Dallas continued to soften, with annual declines approaching 1 percent. Houston prices rose 0.7 percent year over year in August after a small gain in July. Austin and San Antonio remained below year-ago levels, but with the pace of decline moderating further.
In other words, two halves of the same metropolitan area are moving in opposite directions. Fort Worth is up four months running while Dallas is down about 1 percent. Anyone using a DFW-wide price figure to value property in either city is averaging away the signal.
By contrast, how are prices behaving outside the big four?
Stronger, in at least one case. The Federal Reserve Bank of Dallas reported that the nominal median price of homes sold in the Permian Basin was $346,000 in September 2026, up 2.7 percent over three months and 4.7 percent from a year earlier, against a Texas median of $329,000 that was down 0.9 percent year over year. Adjusted for inflation, Permian prices were up 2.6 percent year over year while Texas real prices rose 1.1 percent.
Permian sales volumes, however, fell 8.8 percent from June to September and were down 1.9 percent from a year earlier. That is the same pattern as the state as a whole, only more pronounced: fewer transactions at firmer prices.
What do inventory and days on market show?
Supply built through spring and summer and then began its normal seasonal decline. Month-end active inventory was 151,400 in August, down 2.5 percent from a July peak of 155,300 and 1.8 percent below year-ago levels. That equates to a 5.3-month supply.
| Indicator | August 2026 | Year earlier |
|---|---|---|
| Closed sales | 28,740 | -4.7% change |
| Median sales price | $330,000 | $335,000 |
| Month-end active inventory | 151,400 | -1.8% change |
| Months of inventory | 5.3 | n/a |
| Average days on market, sold homes | 65 | 63 |
| Average days on market, unsold inventory | 95 | n/a |
| Inventory turnover rate | 18.4% | 18.4% |
| Median seller price cut | $14,900 | n/a |
| New listings | 48,600 | -1.9% change |
Two numbers in that table deserve more attention than they usually get. The inventory turnover rate, calculated as pending sales divided by average inventory, was 18.4 percent, unchanged from a year earlier. Fewer than one in five listed homes went under contract during the month. And the average days on market for unsold inventory was 95 days against 65 days for homes that sold, a 30-day gap that measures how much of the listed stock is simply not priced to move.
The median seller price cut was $14,900, roughly 4 percent of the initial listing price, and the center notes reductions have ticked up since the peak summer season. That is the clearest quantification of seller concessions available in Texas data, and it says sellers are discounting by about one twenty-fifth of asking price to transact.
Are sellers still listing?
Broadly yes. Statewide, 48,600 new listings entered the market in August, down 12.8 percent from July in a normal seasonal pattern and 1.9 percent below year-ago levels. Year-to-date listing activity was down just 0.4 percent through the first eight months of 2026, which is effectively flat.
The exception is Dallas-Fort Worth, which the center identifies as the weakest large market on the supply side, with new listing volumes soft since April and year-to-date activity trailing last year. DFW active listings fell 4 percent between July and August, leaving month-end inventory 5.9 percent below year-ago levels. Austin, Houston and San Antonio held comparatively stable on both listings and inventory.
That combination in DFW, falling sales and falling inventory together, is characteristic of a market where both sides step back rather than one capitulating.
Why are mortgage rates the decisive variable now?
Because they moved against buyers in October, and they moved for an unusual reason. The center’s Texas Economic Outlook for November 2026, published November 16, reports that average 30-year mortgage rates rose 21 basis points in October, from 7.03 percent to 7.24 percent, even as the 10-year Treasury yield fell 35 basis points from 5.29 percent to 4.94 percent.
The result was a sharp widening of the mortgage spread, the premium of the 30-year mortgage rate over the 10-year Treasury, from 174 basis points to 230 basis points. The report notes the spread’s typical range is 150 to 175 basis points, and attributes the widening to a decline in expected future interest rates, which raises refinancing risk for lenders. The Federal Reserve’s divestment of mortgage-backed securities is cited as a further source of upward pressure on mortgage rates.
| Measure | Start of period | End of October | Change |
|---|---|---|---|
| 30-year mortgage rate | 7.03% | 7.24% | +21 bp |
| 10-year Treasury yield | 5.29% | 4.94% | -35 bp |
| Mortgage spread | 174 bp | 230 bp | +56 bp |
This matters because the usual playbook does not apply. Normally a falling Treasury yield gives mortgage borrowers relief. In October it did not, because the spread absorbed the decline and more. A Texas buyer saw rates rise while the benchmark bond they are supposedly priced off fell.
The macro backdrop raises the stakes further. U.S. economic growth ran at a 3.4 percent annual rate in the third quarter of 2026, led by consumer spending and artificial intelligence related business investment. October payrolls expanded by 165,000, with August and September revised up by a combined 84,000, unemployment fell from 4.2 percent to 4.1 percent and annual wage growth rose from 3.0 percent to 3.1 percent. After holding rates steady in October, the center notes the Fed could be inclined to raise rates at its December meeting to address persistent inflation.
What does this mean for the rest of 2026?
The center’s own expectation is explicit: housing activity is likely to remain restrained and could slow further through the remainder of the year, with mortgage rates back above 7 percent, a threshold that weighed heavily on buyers and sellers during the 2023 downturn. It also warns that the year-to-date sales lead over 2025 is expected to narrow.
On the Texas labor side the picture is mixed. State job growth dipped 0.1 percent month over month in September while still growing 1.0 percent year over year against roughly 0.3 percent nationally. Employment declined in every Texas metropolitan area in September except Abilene and College Station-Bryan, with contraction across most industries other than manufacturing, information, professional and business services, and other services.
Permitting data from a third source completes the supply picture. Hunt Institute calculations using Census Bureau figures show single-unit private building permits per 100,000 inhabitants falling in most large Texas metros for January through July 2026 against the same period of 2025: Houston down 5.0 percent, Dallas-Fort Worth down 3.3 percent, San Antonio down 3.1 percent, Austin down 2.4 percent and Laredo down 11.2 percent, with El Paso the lone gainer at up 0.7 percent.
Put together, the Texas housing market entering winter 2026 has stabilizing prices, roughly flat listings, a 5.3-month supply, slowing permits and the most expensive financing of the cycle. Price stabilization achieved at 7.24 percent mortgage rates is a genuinely better foundation than price declines at 6 percent, but it is a foundation for a low-volume market rather than a recovery.
Frequently asked questions
Are Texas home prices falling in 2026?
No longer, on an index basis. Statewide annual price growth was flat in August 2026, ending a 15-month stretch of year-over-year declines. The median sales price was $330,000, down from $335,000 a year earlier.
How much housing inventory does Texas have?
151,400 active listings at the end of August 2026, equal to a 5.3-month supply, down 2.5 percent from the July peak of 155,300 and 1.8 percent below year-ago levels.
What are mortgage rates in Texas now?
Average 30-year mortgage rates rose from 7.03 percent to 7.24 percent during October 2026, while the 10-year Treasury yield fell to 4.94 percent, widening the mortgage spread to 230 basis points.
How much are Texas sellers cutting prices?
The median seller price cut was $14,900 in August 2026, roughly 4 percent of the initial listing price, and reductions have increased since the peak summer selling season.
Which Texas metro is weakest right now?
Dallas-Fort Worth. Sales fell 11 percent year over year in August, new listing volumes have been soft since April, and month-end inventory was 5.9 percent below year-ago levels.
How long are Texas homes taking to sell?
Homes sold in August spent an average of 65 days on the market against 63 days a year earlier. Unsold inventory averaged 95 days, and the inventory turnover rate was 18.4 percent.
Sources and Further Reading
- Texas Housing Insight, October 2026, published October 23, 2026 — Texas Real Estate Research Center, Texas A&M University
- Texas Economic Outlook, November 2026, published November 16, 2026 — Texas Real Estate Research Center, Texas A&M University
- Permian Basin Economic Indicators, Third Quarter 2026 — Federal Reserve Bank of Dallas
- Paso del Norte Economic Indicator Review, September 2026 — Hunt Institute for Global Competitiveness, The University of Texas at El Paso
- Survey of New Construction and existing home sales data — U.S. Census Bureau and National Association of REALTORS